Consulting - Quality
Difference makes the DIFFERENCE
Categorised Menu List
Henry Gantt Chart
Used in Schedule against Completion monitoring
Gantt Chart, is named after Henry Gantt. This graph is used to display activities or programs as a part of time. Each is shown on a horizontal bar (generally). Each bar or activity has a specific start date and end date. Considering the complete can display the time intervals by which each activity would be completed.
In simple terms:
- What - a methods to divide full scale programme into significant parts
- Why - a tool to depict probable dates of completion of a task
- When - in project management or activity/event management
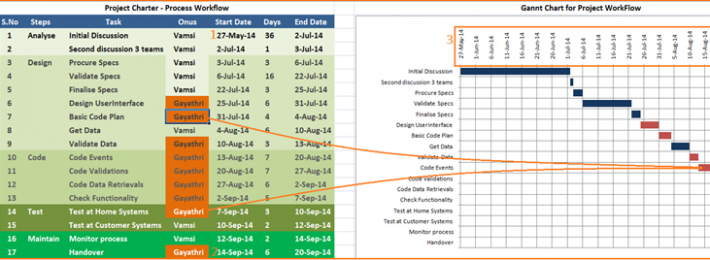
What Gantt Chart does:
- Number of steps in course of completion of Project
- various stages of a Project
- different steps involved at each stage of the Project
- start date and end date for each step in the Project work flow
- days required for completion of each step
- time consumption from start of the Project to the end
- People involved and their respective responsibilities

Follow the following Procedure, following the above picture:
- Start typing start date and end date for each step
- Insert additional rows if required at each step
- Insert additional steps if required.
- You can observe the chart being filled automatically.

To adjust dates with the dates displayed in the graph,
follow the picture displayed above:
- Right Click Mouse by placing cell pointer in the start date of the project (point 1 in the first figure) Format Cells dialog box is displayed
- by default you can see text displayed in Date format - Move to General Column - Number with respect to the date is displayed.
- Right Click Mouse by placing the mouse on the X-Axis of the graph (point 3 in first figure) Format Axis dialog box is displayed.
- Type the number (eg: 41786) at the Minimum value.
- Likewise, repeat the above steps for the end date (point 2 in first figure) of the project as well.
- Dates on the graph will automatically get adjusted as per the sheet data.