Home
about
about me
Certifications
Padhai - DataScience
Lean Six Sigma
Six Thinking Hats
Q & A with Children
Content
about content
Personal Content
Quality, Re-Engg. & RPA
Up-Skill
VBA Code - Ms. Excel
VBA Code - Ms. Outlook
Alexa Skills =>
Six Sigma Facts
Class 1 Science
Class 4 Science
Class 4 Science Quiz
Class 4 Social Quiz
Class 4 Social Studies
Machine Learning - Misc =>
Logistic Regression CW
Logistic Regression Exercise
Chloropleth Maps
Plotly and Cuff Links
Tensor Flow
Padhai Class room Demo =>
FDS Week 3 Assignment 1 - Solutions part - 1
FDS Week 3 Assignment 1 - Solutions part - 2
FDS Week 5 Assignment
FDS Week 5 Assignment - Solutions
FDS Week 10 - Pandas DataFrames
FDS Week 11 - Data Visualisation - 1
FDS Week 12 - Data Visualisation - 2
FDS Week 13 - Handling Missing Data
Padhai - Data Objects - Sequential
Padhai - Data Objects - Sets
Padhai - Data Objects - Object Mapping
Padhai with Data Science
Python links for Data Science and ML
Videos
General Interest
Professional Interest
Site Map
Consulting - Quality
Difference makes the DIFFERENCE
Data Science Learning & Exercises Menu
Padhai counting without counting =>
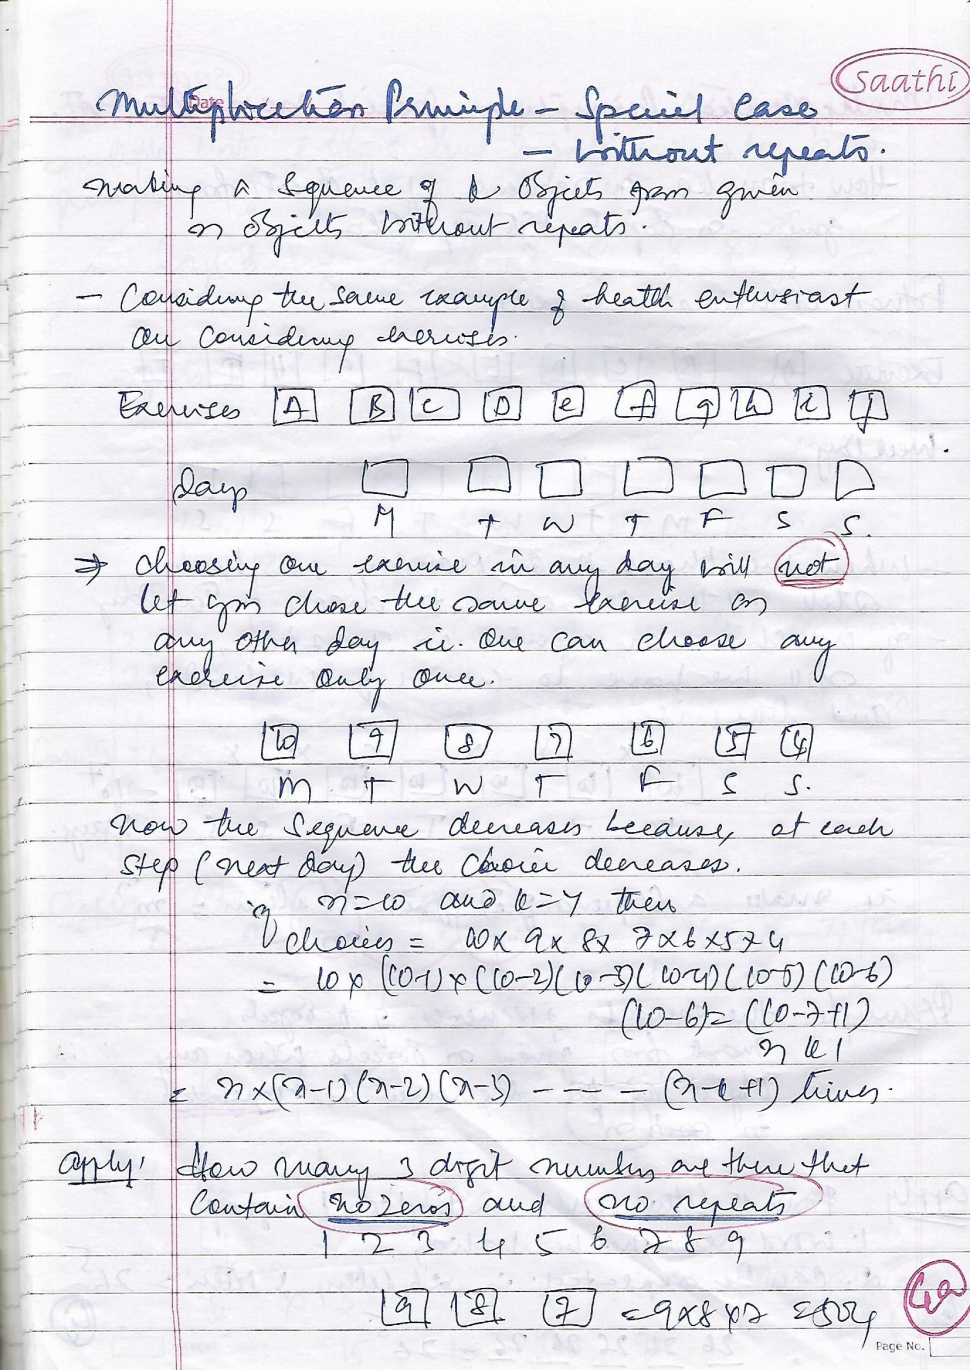
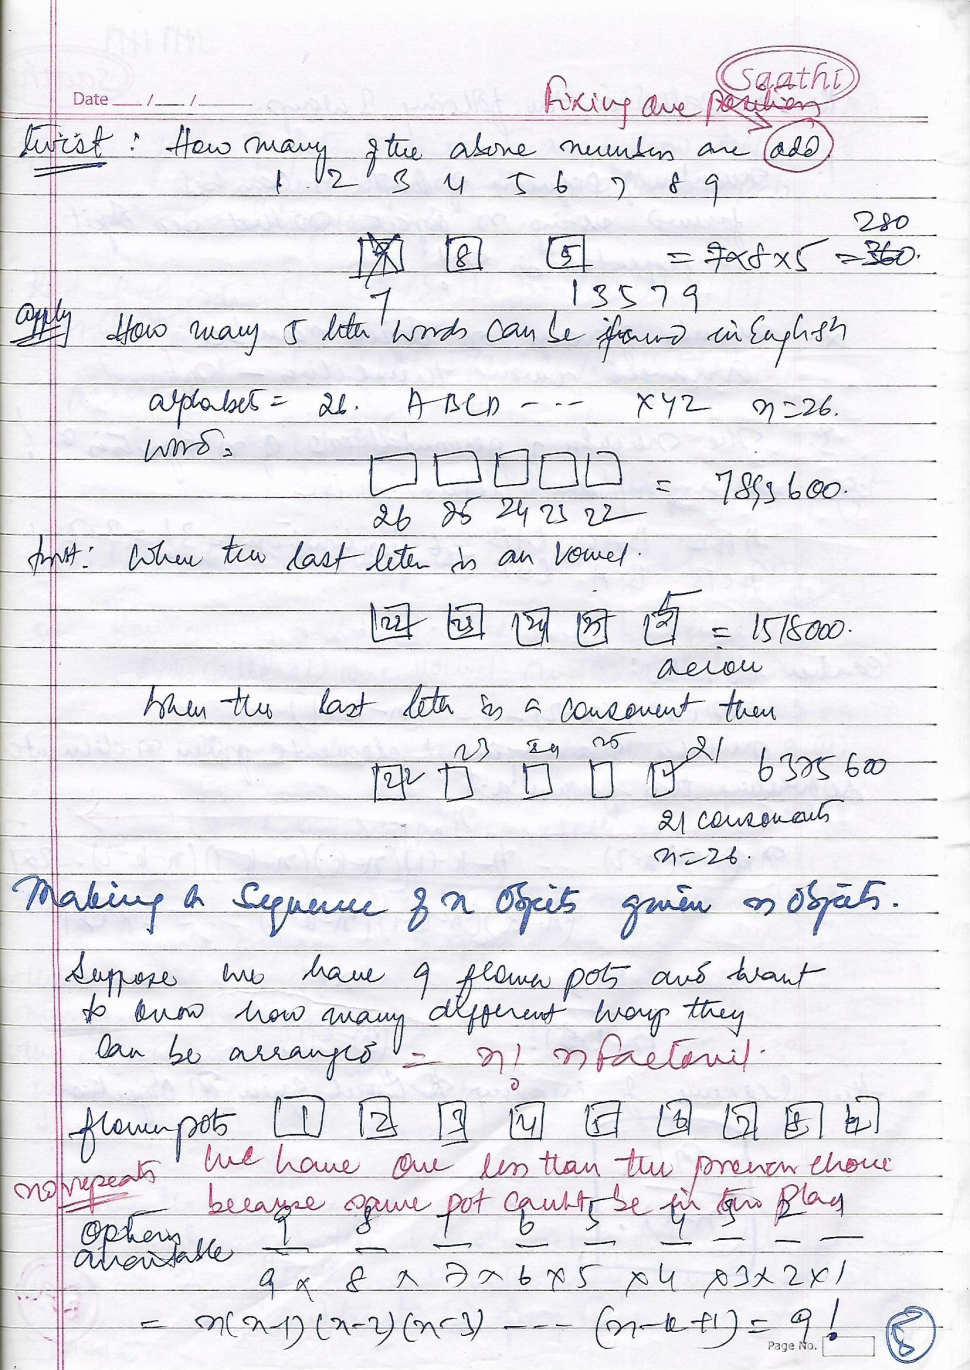
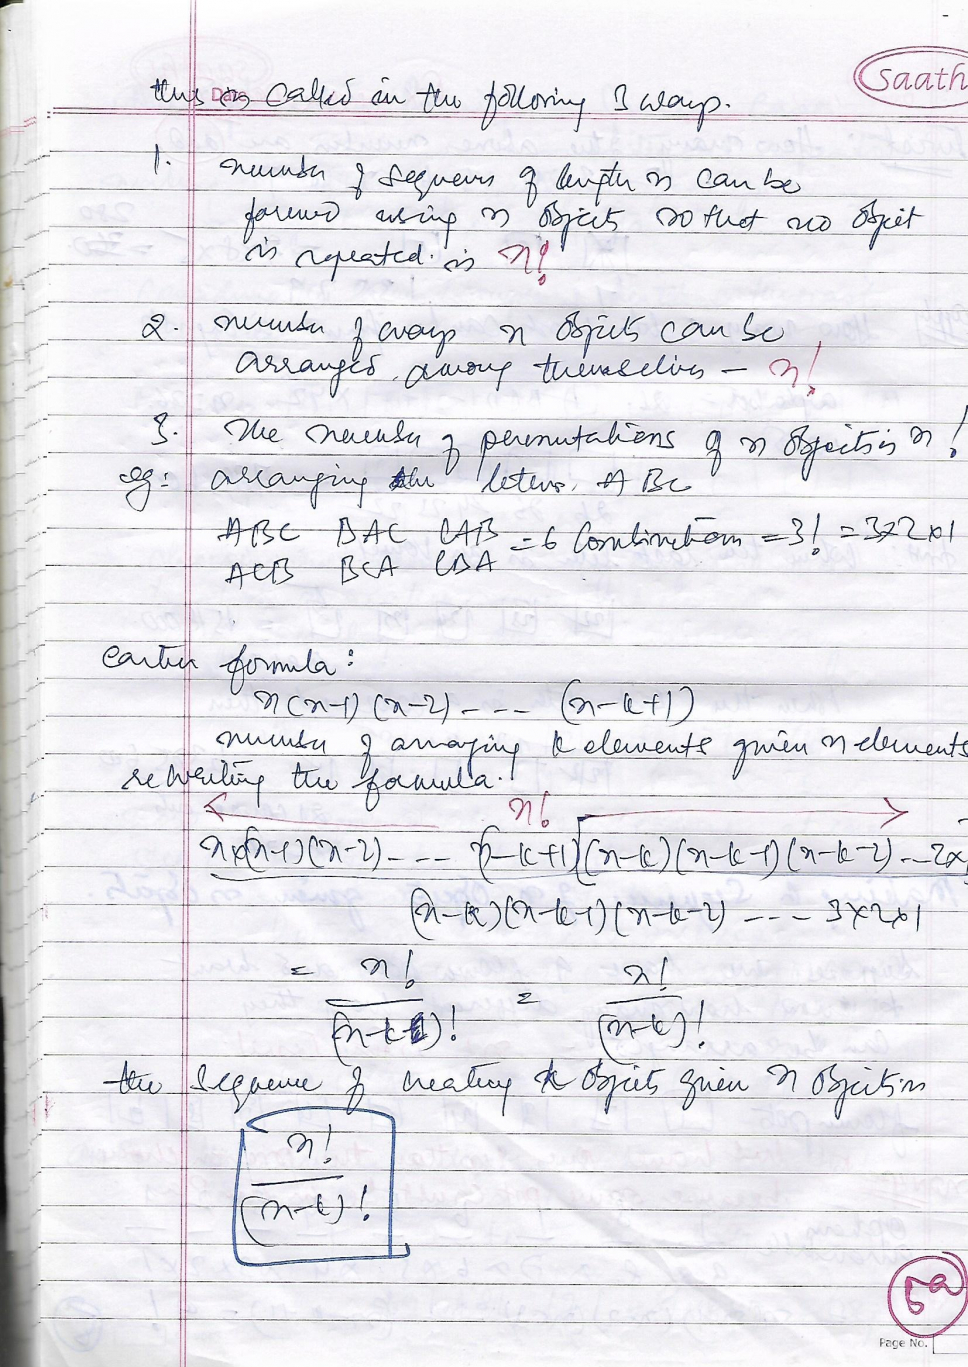
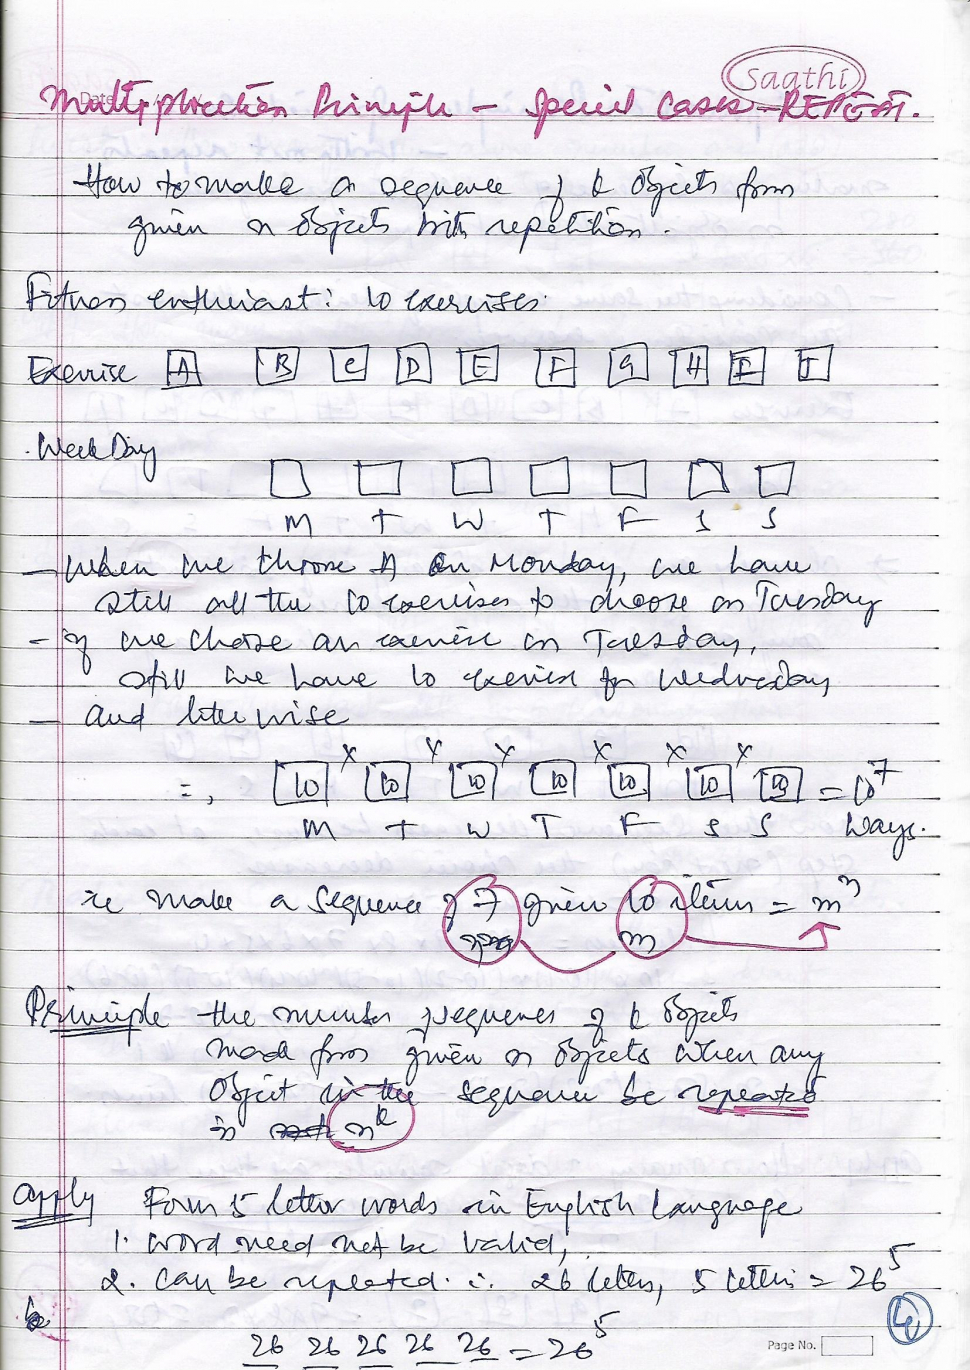
Introduction, Multiplication Principle
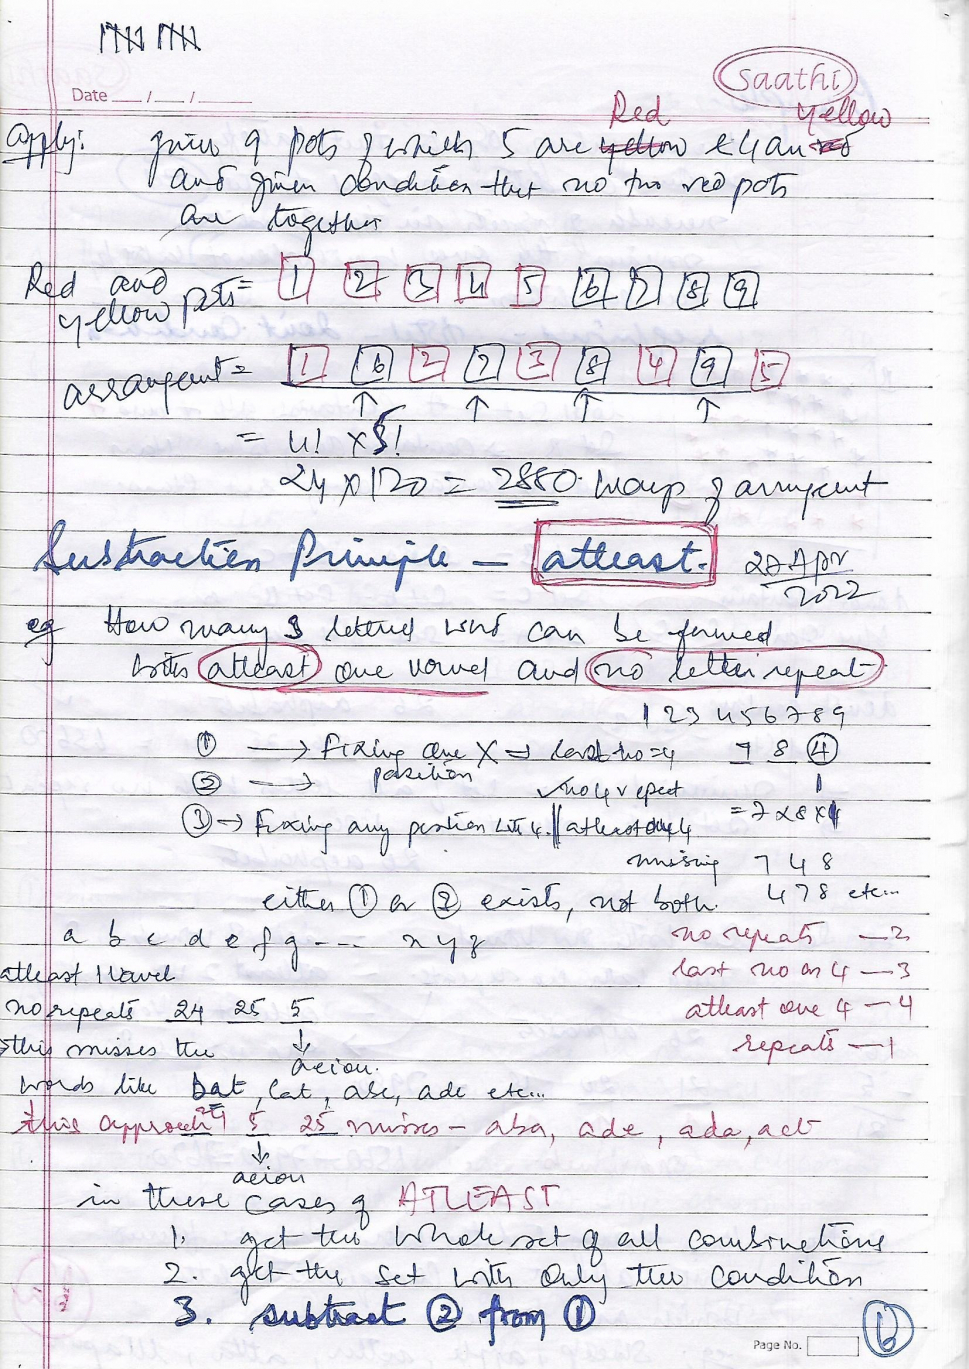
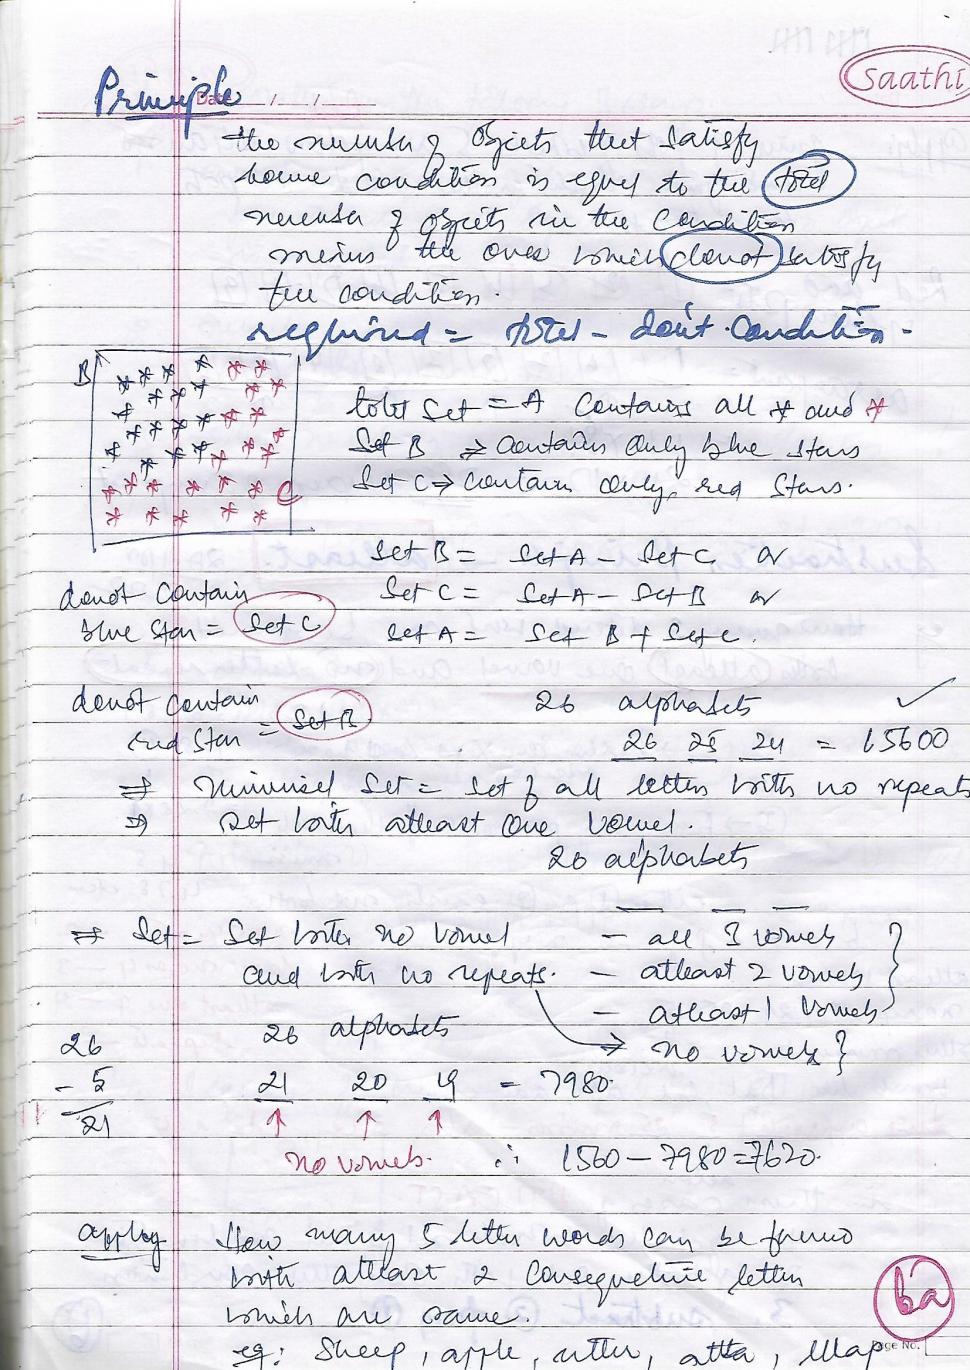
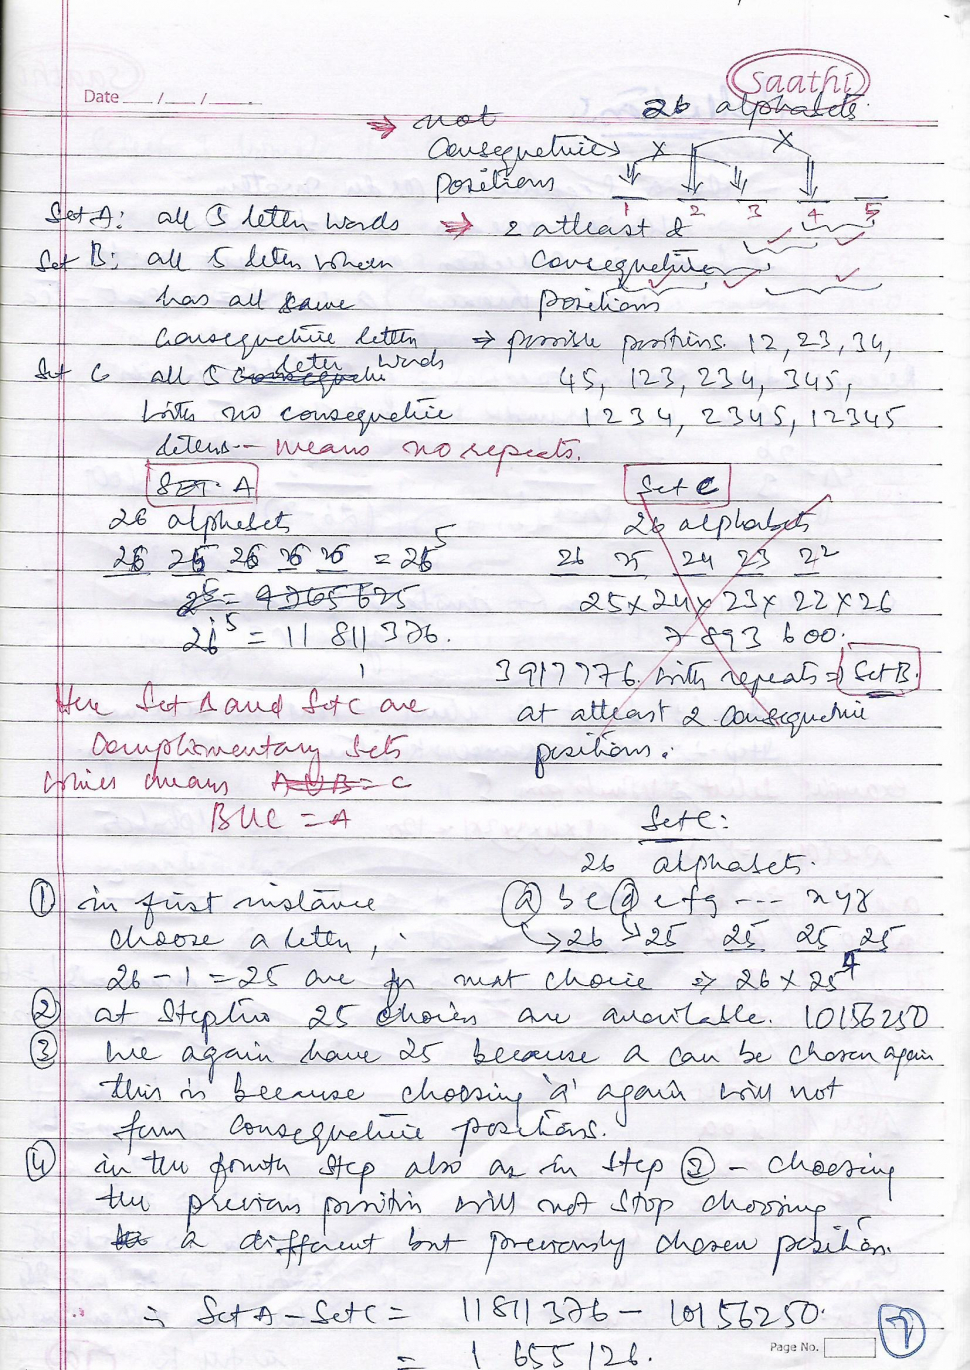
Subtraction Principle - Atleast
Collections
Summary and quiz
Padhai - Sets and Probability =>
Intro. to Sets and Probability
Axioms and Properties
Conditional Probability
Total Prob., Bayes Theorum
Only Examples
Padhai - Random Variables =>
Random Variables
Probability Mass Function
Bernoulli Dist. - only two outcomes
Bi-nomial Dist. - n outcomes
Geometric Distribution
Expectations, Linearity
Quiz - Explained
Padhai Numpy Library =>
Numpy - Overall Understanding
Numpy - Statistical Functions
NumPy Exercises
Padhai Pandas Library =>
Pandas - Series
Pandas - DataFrame
Pandas IterRows f() and DELETE NaN
Pandas Replace f()
Pandas - FILTERS
Padhai - Visualisations - Pandas =>
Handling Missing Data
Pandas Visualisations
Padhai - Visualisations - Seaborn =>
Seaborn - Histogram Plot
Seaborn - Paired Violin Plots
Seaborn - Boxplot
Seaborn - Categorical Bar Plot
Seaborn - Joint plots
Seaborn - Swarm Plots
Seaborn - Violin Plots
Seaborn - Multiple Violin Plots
Seaborn - Faceted Plotting
Seaborn - Scatter Plots
Seaborn - Bar and Line Plots
Padhai - Visualisation - Matplot Lib =>
Pie Chart, Donut, Nested Donut
Stacked Bar Plot
Stacked Area Plot
Open DS - Cleaning and Visualisations =>
Clean Agriculture Dataset
Open Agriculture DS - Bar, Boxes and f()s
Open Agriculture DS - working 01
ameo with Pandas Visualisations
Miscelleneous Code Pages =>
Date based age buckets
Re-arrange cols with Pandas
CHLOROPLETH MAPS
Logistic Regression CW
Logistic Regression Exercise
Plotly and Cuff Links
TENSOR FLOW
Basic Help
File handling
Python Basics
Error Handling and Lists
Merge - Join - Concatenate
Querying a DataFrame
COUNTING without COUNTING -2 CLASS WORK
Top